
Luminaire
Comparisons


Quick Compare
Compare Up to 4 Luminaries Head to Head
Illuminance Part 1: Distribution
Manufacturers love comparing their lights to industry standards – especially when it comes to claims about brightness. Unfortunately, these claims come from each company’s own standards and lack uniformity across the industry. Additionally, output alone cannot provide a true understanding of a fixture’s characteristics. Through this series, we will examine the elements to consider when making output comparisons, beginning with Illuminance Distribution.
The brightness of a light is initially derived from the measure of luminous flux and its distribution (Figure 1). Luminous flux describes the amount of light energy created, measured in lumens and more commonly referred to as a source's intensity.
BRIGHTNESS (Lumens/Candela/Lux)
Any measure of luminous flux within a given context.
Lumens = In Total
Candela = Across a given angular span
Lux/Footcandles = Across a given area
ILLUMINATION (Lux)
INTENSITY (Lumens)
Total Luminous Flux (Light Energy Created)
Light Energy calculated across 1m²

Figure 1
An electrically charged gas or semiconductor or a heated material creates light energy - referred to as luminous flux (lumens). How that energy is handled is the duty of the light fixture. All manufactured fixtures begin with a source which is usually controlled using a reflector and a front element, such as a lens or diffusion panel. Intensity is a fixed quantity of luminous flux that the source is able to create. Illumination is the luminous flux measured across a defined surface area - Lux uses 1m² whereas Foot-candles uses 1ft². Because this surface area never changes, when the light spreads out over distance, less of it covers that same surface area. This means that Illumination will decrease over distance, but intensity will never change - unless the power level changes (dimming). Candela measures the lumens across the angular span of one steradian of a sphere, with the center of the sphere being the origin point of the light source.
The problem is while two lights may create the same amount of light, if one concentrates all of that light into a small area, and another distributes it evenly across a space, each fixture will produce significantly different light levels when measured at the same distance (Figure 2).


Alone, the lamp will radiate light evenly in all directions (isotropically) and produce a measurement of 204 Lux at 5 meters.
Figure 2
An 800 watt Joker HMI lamp emits 64,000 lumens.

When placed inside a housing and given a reflector, that same lamp will distribute light differently (directional) and will produce a measurement of 60,000 Lux at that same 5' meter distance.
There are different factors that impact how a fixture’s light is distributed, and those factors will also influence other characteristics such as illuminance and falloff. These are important elements to consider when choosing a light, but we will first look at distribution's effect on characteristics known as punch, wash and throw. Each of these characteristics are quantifiably associated with a luminaire's beam angle, field angle and slope angle. These measurements all concern the concentration of light across an angular span.
Measuring this concentration across a planar surface area helps add even greater practical context. This group of measurements is referred to as the Planar Illuminance Distribution table and is most clearly represented by graphing those measurements into a curve. While some manufacturers will offer measurements of their fixture’s planar illuminance distribution, they each use different scales and methods, making comparisons between different fixtures unreliable. We decided to conduct our own test that would level the playing field across all fixtures, adding important context and supplementing various brightness measurements.

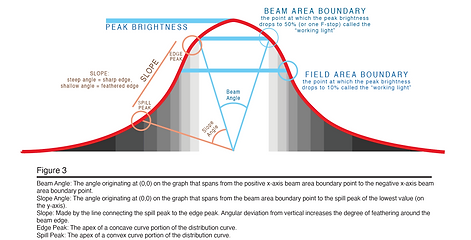
ANATOMY OF AN ILLUMINATION DISTRIBUTION GRAPH
(Hover to Explore)
PEAK BRIGHTNESS
SLOPE
The apex of a convex curve portion of the distribution curve
SPILL PEAK
Steep Angle = Sharp Edge
Shallow Angle = Feathered Edge
50º
40º
30º
20º
10º
0º
10º
20º
30º
The apex of a concave curve portion of the distribution curve
EDGE PEAK
-
the point at which the peak brightness drops to 50% (or 1 F-stop)
-
called the working light
-
defines the "beam angle"
BEAM AREA BOUNDARY
-
the point at which the peak brightness drops to 10% (or 1 LOG)
-
called the "usable light"
FIELD AREA BOUNDARY
Beam
Angle
Beam Angle = 30º
3 Characteristics of an Illumination Distribution Curve
-
Beam Spread: How wide is the Beam Angle?
-
Edge Definition: What is the ratio of slope angle to beam angle? The greater the ratio, the more defined the beam edge is.
-
Uniformity: How smooth is the curve? Does it have multiple Spill and Edge Peaks? Is there a visible spike across a narrow angle? Is there a relatively even illumination level across the beam and field area boundaries? The Beam Angle?
Throw, Punch & Wash: Quantified
Throw: A smaller beam angle AND a smaller slope angle mean that more of the luminous flux will be efficiently focused with a defined beam edge and the size of that beam spreads out gradually over a far distance. This will provide greater illuminance at far distances.
Punch: A smaller beam angle BUT a larger slope angle mean that there is high illuminance in the center of the beam, also known as a hot spot, but that there is no defined beam edge. The result is light that can illuminate a larger area, but with a very bright center focus region that remains small, producing more uni-directional shadows from a single origin.
Wash: A larger beam angle AND a larger slope angle mean that illuminance is very evenly spread out across a wide area.
Testing
Placing a light 5m from a measurement plane, we gathered 15 separate, angle-targeted readings from the center of the beam down the plane to the right along the horizontal axis. While a more comprehensive test would include the vertical axis as well, most of the light fixtures had circular front elements, meaning that their beam spread should be relatively similar along both the horizontal and vertical axes. It is important to note that these curves do not apply to the vertical distribution of illuminance on fixtures with square and rectangular front elements, only to their horizontal distribution.
Although manufacturers perform a similar test to convey illumination distribution, there are three key differences in our method.
Rather than measuring isometrically (at an equal distance from the center of the light for anywhere from 180º-60º), we choose to measure along a planar surface because this yields the most practical results for usage in the industry (shooting through diffusion, bouncing, washing cyc walls, etc). This meant that not only did the angle change with each measurement, but the overall distance from the source did as well.

Figure 4
Pink lines/Dots show approximation of points of measurement along the 5m plane. In total, 15 separate measurements were taken from 0º to 65º. Measurements were only taken from the center of the source moving away to the right along a horizontal plane. Lamp left measurements are symmetrically identical and denoted by a negative angle in the graphs

Figure 5
Isometric distance measurements are performed along an angular span, maintaining the same distance from the angular point of origin at all times. Planar distance measurements are performed along the same angular span but along a fixed plane, perpendicular to the line connecting the angular point of origin and the center point of the plane. Planar distance measurements are not equidistant to the primary measurement distance.
Manufacturers measure with candelas because this makes calculating the output at any distance possible. However, that is only applicable if the light is a true point source – which no manufactured lights are. This means that, according to manufacturer data, any indication of how a light will perform when used in a real-world environment is misleading and inaccurate. We measured all sources at a 5 meters planar distance. We chose 5 meters because at this distance, the falloff rates for the lights tested have roughly evened out to give a more equitable representation of intensities. Increasing the distance beyond 5 meters would have introduced spill and ambient bounce, skewing the readings.
Manufacturers publish their data using “relative intensity” along the y-axis of their graphs because they are referring to the change in output for that light only, so it can be based off of the peak intensity of that specific fixture, and used to calculate at any distance from the source. As we mentioned, those calculations will not match actual measurements, and relative intensity does not allow for the comparison of illumination curves between two or more lights. By us measuring illumination rather than intensity, maintaining scale uniformity among all graphs, and setting the y-axis to a logarithmic scale*, any fixture’s graph can be placed beside another to give an accurate comparison of the planar illumination distribution across fixtures.
In addition to the planar distribution graph, we have provided the beam angle, field angle and useful information on the spread - including beam and field spread sizes at 1, 3, 5, 7, and 10 meters. While much of this information is easy to calculate on your own, we felt it could be helpful to have the data included in the context of filling a frame of diffusion. The "right light" to get the most illumination from a given diffusion size is often debated. While this is not meant to settle that debate, we do provide a measurement we have named "TRUE Lux" which represents the peak illumination that a source is putting out when its beam angle is wide enough to fill a 1m² area. While "filling" a frame could have multiple interpretations, in this case, we consider the frame filled only when the outer edge is a maximum of one-stop lower than the peak illumination. In other-words, this number is concerned with fill AND evenness across the frame. This number is meant to provide a ratio of beam angle to illumination level, as some luminaries may only have high illumination at such a narrow angle that it has a very specialized usage.


Figure 5
A visualization of different planar distribution graphs overlaid with rough approximations of their beam spread upon a planar surface. These examples are intended for the scale of our graphs only.
Results
Filter Search by Color Temperature
Filter Search by Category
Filter Search by Manufacturer
Manufacturer
Fixture Name
Category
Focus
Color Temp
Distance to fill 1m:
0.1234
Beam Angle
0.1234
"TRUE Lux"
0.1234 Lux
Field Angle
0.1234
1m
0.1234
0.1234
3m
0.1234
0.1234
5m
0.1234
0.1234
7m
0.1234
0.1234
10m
0.1234
0.1234


Example Text
Example Text
Example Text
Example Text
Example Text
Example Text
0.1234
Example Text
0.1234
Example Text
0.1234
Example Text
0.1234
0.1234
0.1234
0.1234
0.1234
0.1234
0.1234
0.1234
0.1234
0.1234
0.1234
0.1234
0.1234
0.1234
0.1234
0.1234
category option
category option
category option

Quick Compare
Compare Up to 4 Luminaries Head to Head